
Grafana ↗ 是一种仪表板工具,用于将存储在其他数据库中的数据可视化。您可以使用 Grafana 将您的 Tunnel 指标转化为具有可操作性的洞察。
无法将指标直接从 cloudflared 推送到 Grafana。相反,cloudflared 会运行一个 Prometheus ↗ 指标终结点(metrics endpoint),由 Prometheus 服务器定期对其进行抓取(scrape)。然后,Grafana 将 Prometheus 用作数据源,向管理员展示这些指标。
flowchart LR

  subgraph 192.168.1.1
  A[cloudflared]-->B[指标终结点]
  end

  B--->C
  subgraph 192.168.1.2
  C[Prometheus 服务器]-->D[Grafana 仪表板]
  end
本教程介绍了如何创建指标终结点、设置 Prometheus 服务器以及在 Grafana 中查看数据。
- 您需要一个 Cloudflare Tunnel。要创建 Tunnel,请参阅我们的快速入门指南。
如果您的 Tunnel 是通过 CLI 创建的,请在 cloudflared 服务器(192.168.1.1)上运行以下命令:
cloudflared tunnel --metrics 192.168.1.1:60123 run my-tunnel如果您的 Tunnel 是通过仪表板创建的,必须将 --metrics 标志添加到您的 cloudflared 系统服务配置中。有关具体操作步骤,请参阅添加 Tunnel 运行参数。
在 Prometheus 和 Grafana 服务器(192.168.1.2)上:
-
下载 ↗ Prometheus。
-
解压 Prometheus:
tar xvfz prometheus-*.tar.gz cd prometheus-* -
在文本编辑器中打开
prometheus.yml,并将cloudflared作业(job)添加到该文件的末尾:# my global config global: scrape_interval: 15s # Set the scrape interval to every 15 seconds. Default is every 1 minute. evaluation_interval: 15s # Evaluate rules every 15 seconds. The default is every 1 minute. # scrape_timeout is set to the global default (10s). # Alertmanager configuration alerting: alertmanagers: - static_configs: - targets: # - alertmanager:9093 # Load rules once and periodically evaluate them according to the global 'evaluation_interval'. rule_files: # - "first_rules.yml" # - "second_rules.yml" # A scrape configuration containing exactly one endpoint to scrape: # Here it's Prometheus itself. scrape_configs: # The job name is added as a label `job=<job_name>` to any timeseries scraped from this config. - job_name: "prometheus" # metrics_path defaults to '/metrics' # scheme defaults to 'http'. static_configs: - targets: ["localhost:9090"] ## Address of Prometheus dashboard - job_name: "cloudflared" static_configs: - targets: ["198.168.1.1:60123"] ## cloudflared server IP and the --metrics port configured for the tunnel -
启动 Prometheus:
./prometheus --config.file="prometheus.yml"您还可以选择将 Prometheus 配置为以服务形式运行,这样在机器重启时就无需手动启动它。
-
打开浏览器并访问
http://localhost:9090/。您应该能够访问 Prometheus 仪表板。 -
要验证 Prometheus 是否正在获取 Tunnel 指标,请在表达式控制台中输入
cloudflared_tunnel_total_requests并选择 Execute(执行)。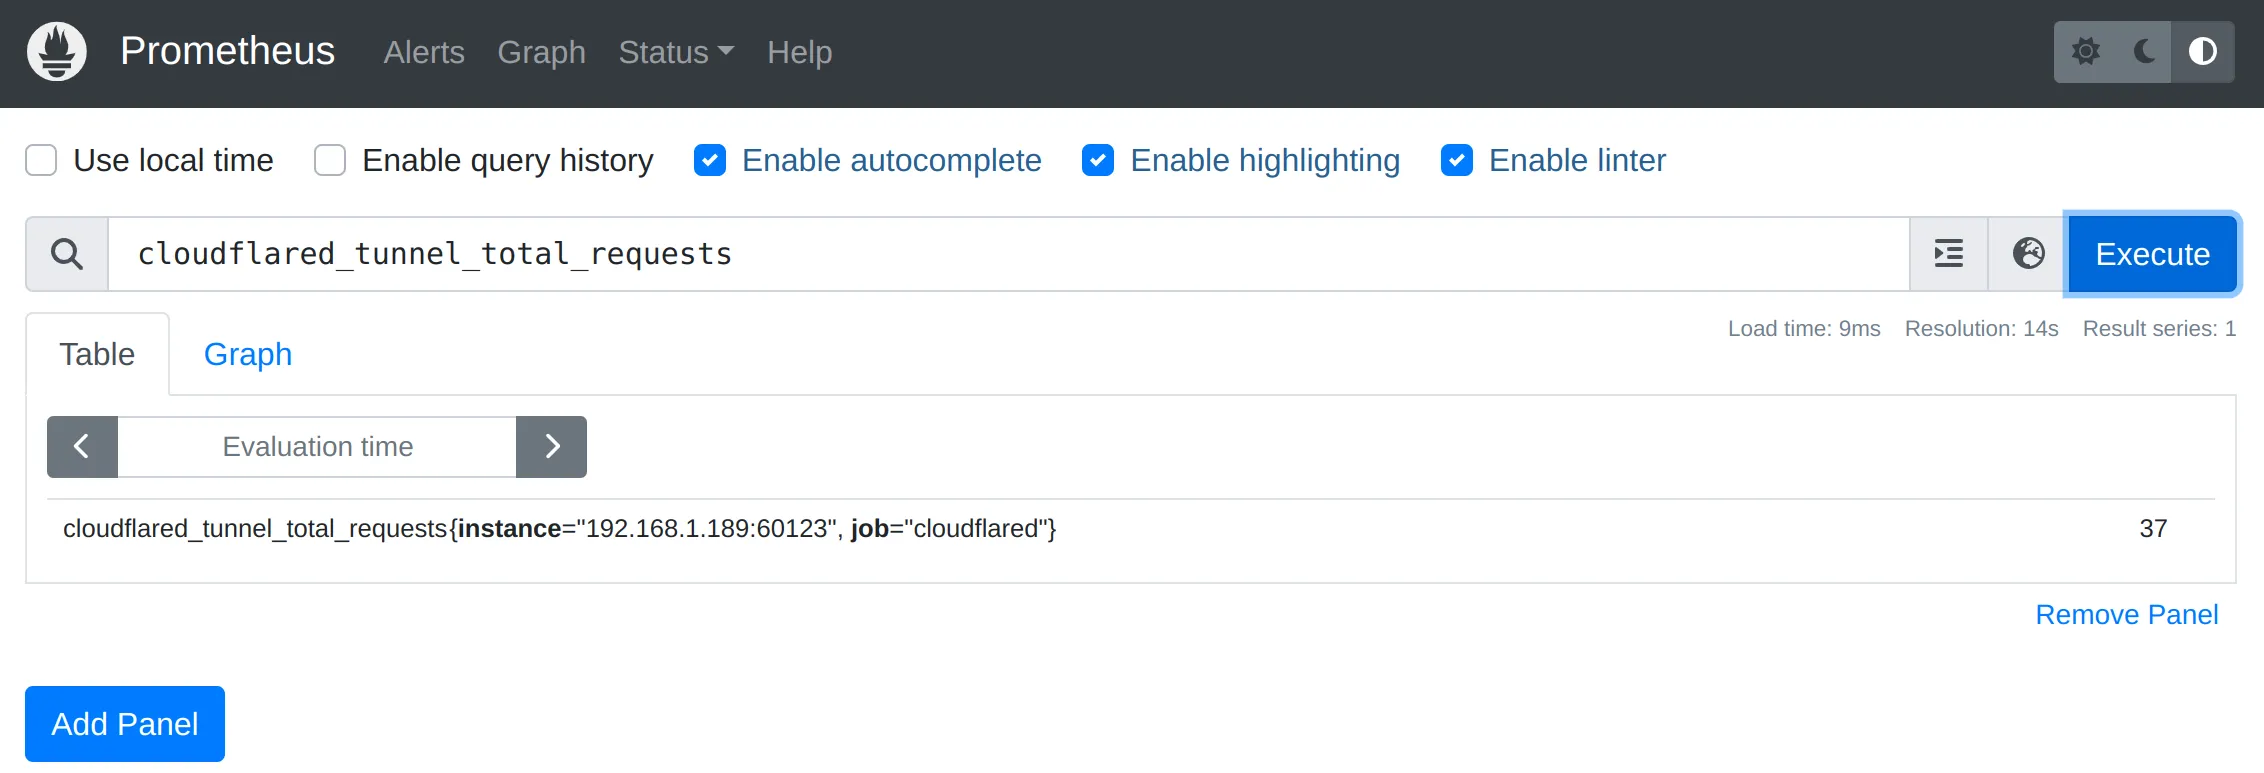
参阅可用指标以检查还有哪些其他可用指标。
-
下载 ↗并安装 Grafana。
-
将 Grafana 作为系统服务启动:
sudo systemctl daemon-reload sudo systemctl start grafana-server -
验证 Grafana 是否正在运行:
sudo systemctl status grafana-server -
打开浏览器并访问
http://localhost:3000/。除非您配置了其他端口,否则 Grafana 侦听的默认 HTTP 端口为3000。 -
在登录页面,输入您的 Grafana 凭据。
要在没有账户的情况下进行测试,您可以将用户名和密码都输入为
admin,并跳过密码修改步骤。 -
在 Grafana 中,转到 Connections(连接)> Data sources(数据源)。
-
选择 Add a new data source(添加新数据源),然后选择 Prometheus。
-
在 **Prometheus server URL(Prometheus 服务器 URL)**字段中,输入您的 Prometheus 仪表板的 IP 地址和端口(
http://localhost:9090)。 -
选择 Save & test(保存并测试)。
- 在 Grafana 中,转到 Dashboards(仪表板)> New(新建)> New dashboard(新建仪表板)。
- 选择 Add visualization(添加可视化)。
- 选择 Prometheus。
- 在指标字段中,输入
cloudflared_tunnel_total_requests并选择 Run queries(运行查询)。您将看到一个显示请求数随时间变化的图表。
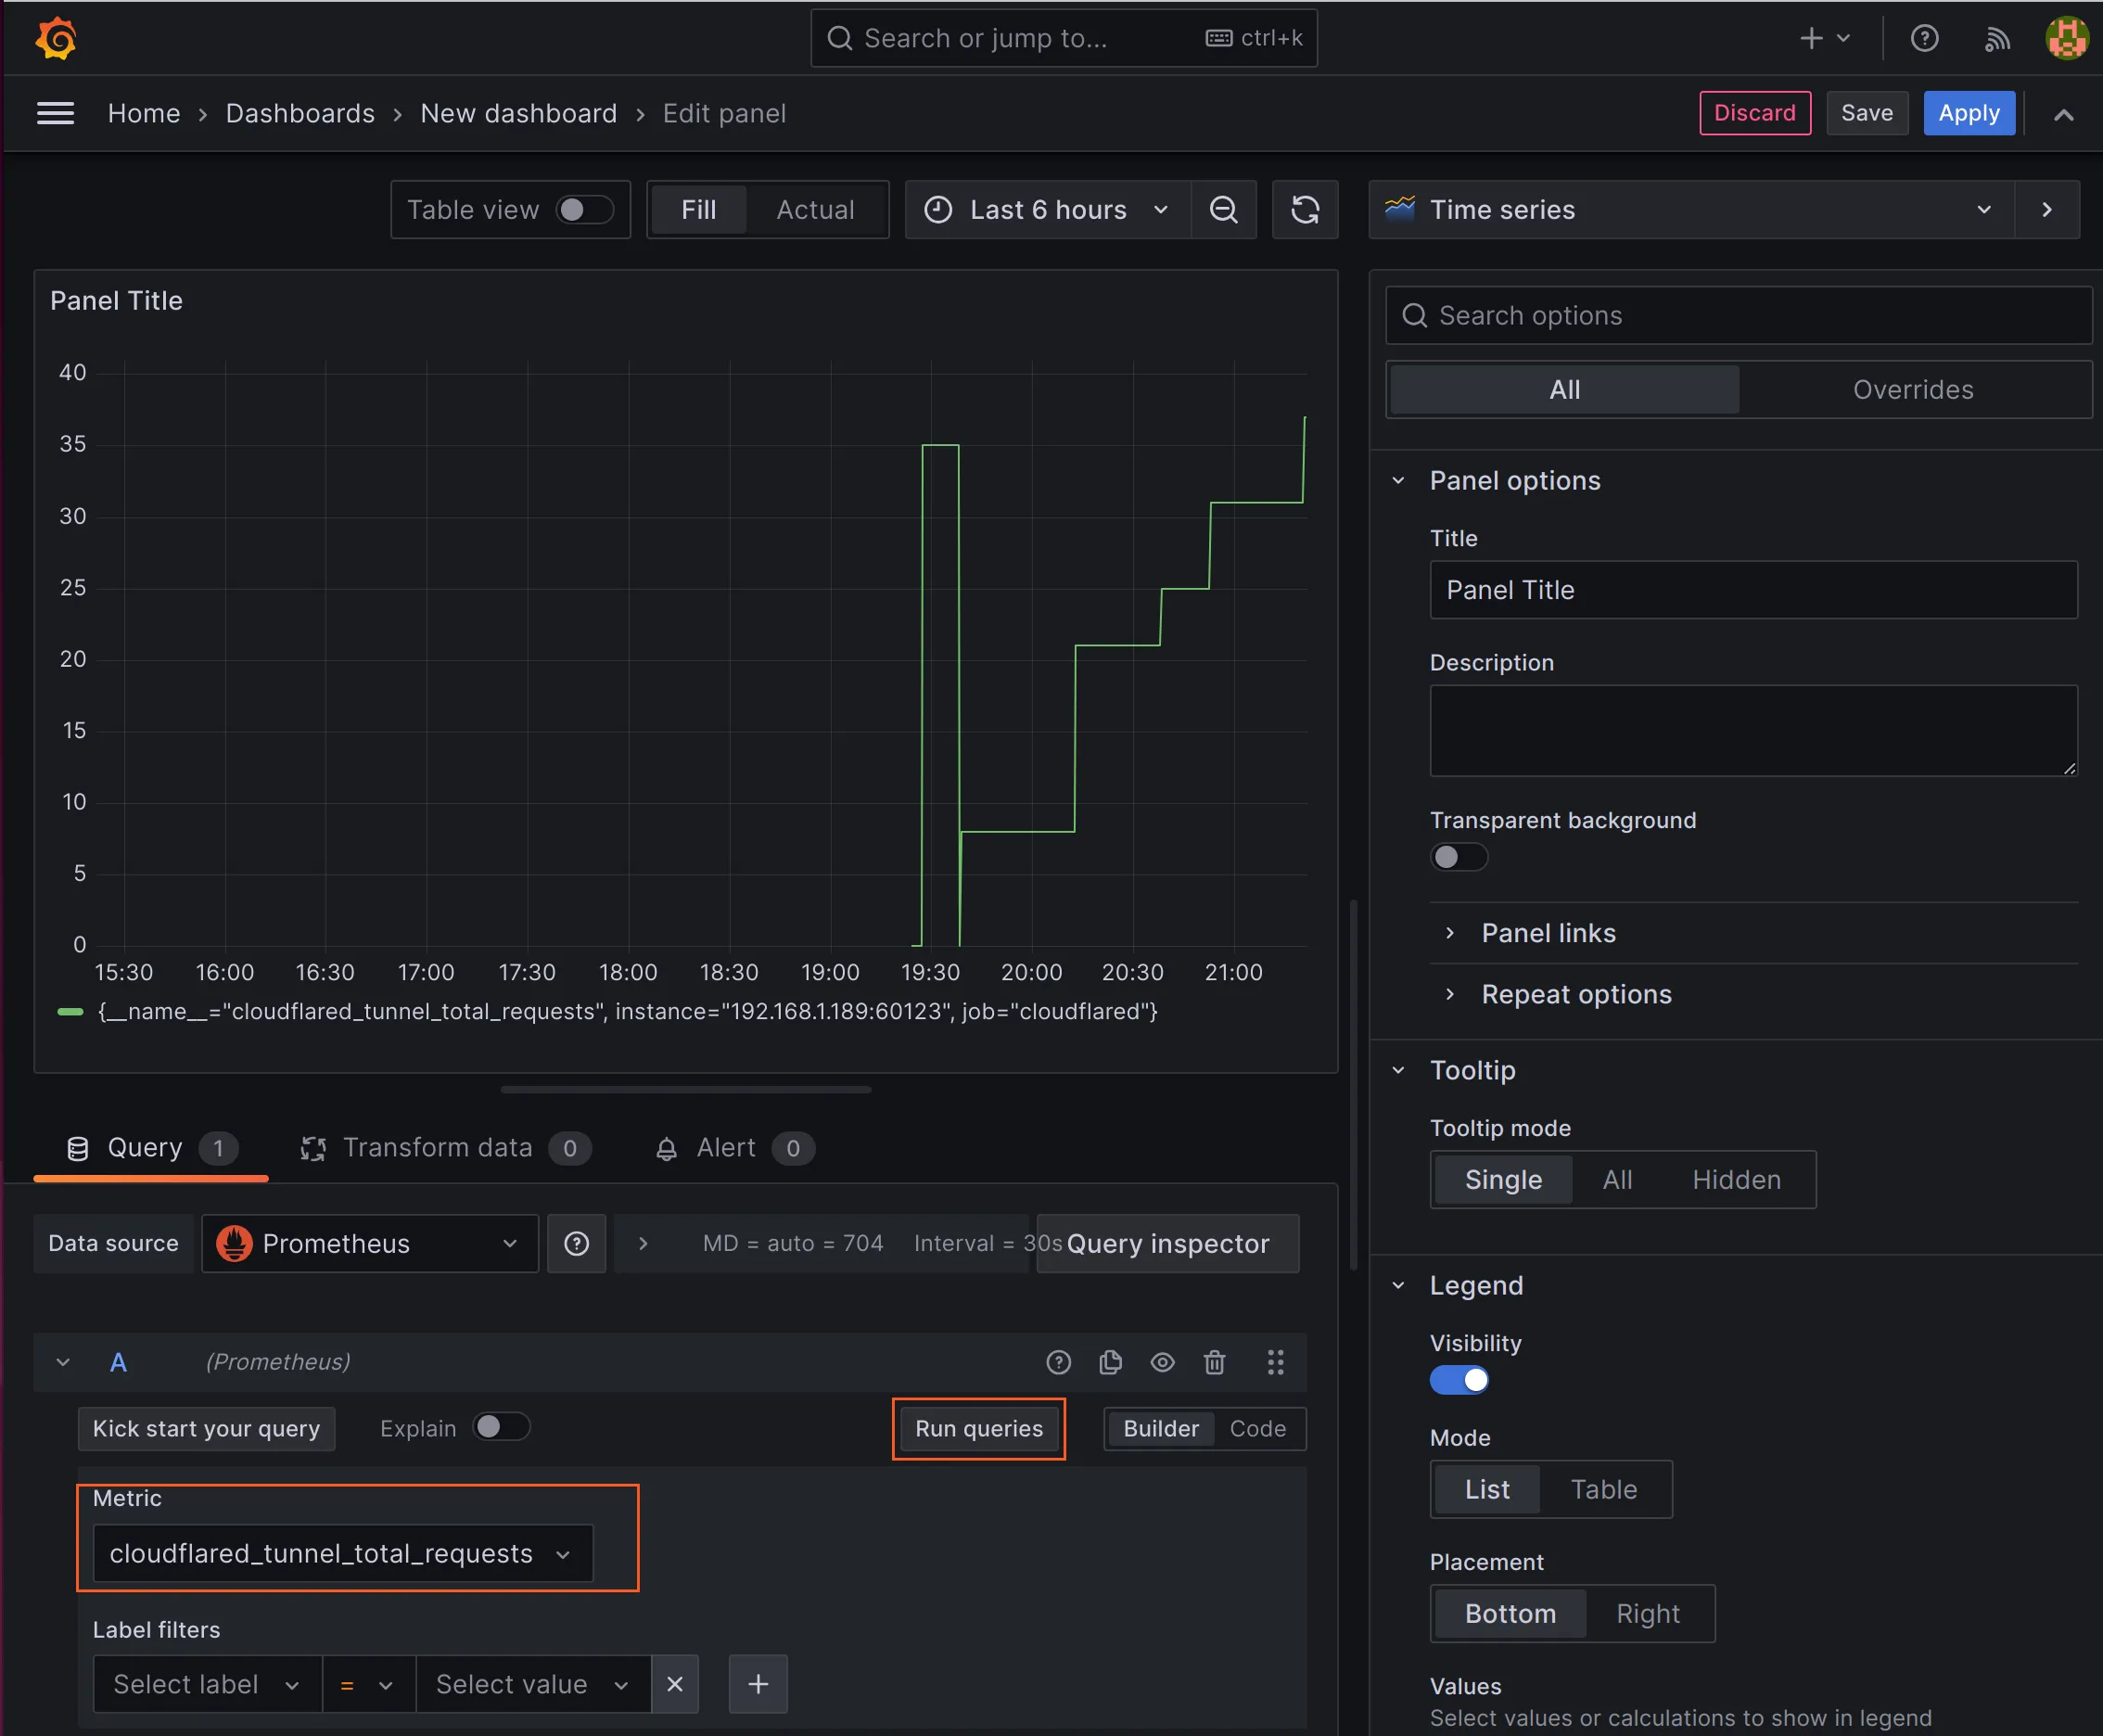
您可以在查询中添加运算以修改显示内容。例如,您可以显示最近一段时间内(例如一天)的所有 Tunnel 请求,而不是自指标开始报告以来的所有 Tunnel 请求。